Data on Accredited Programs
2023-2024 Accreditation Data Report
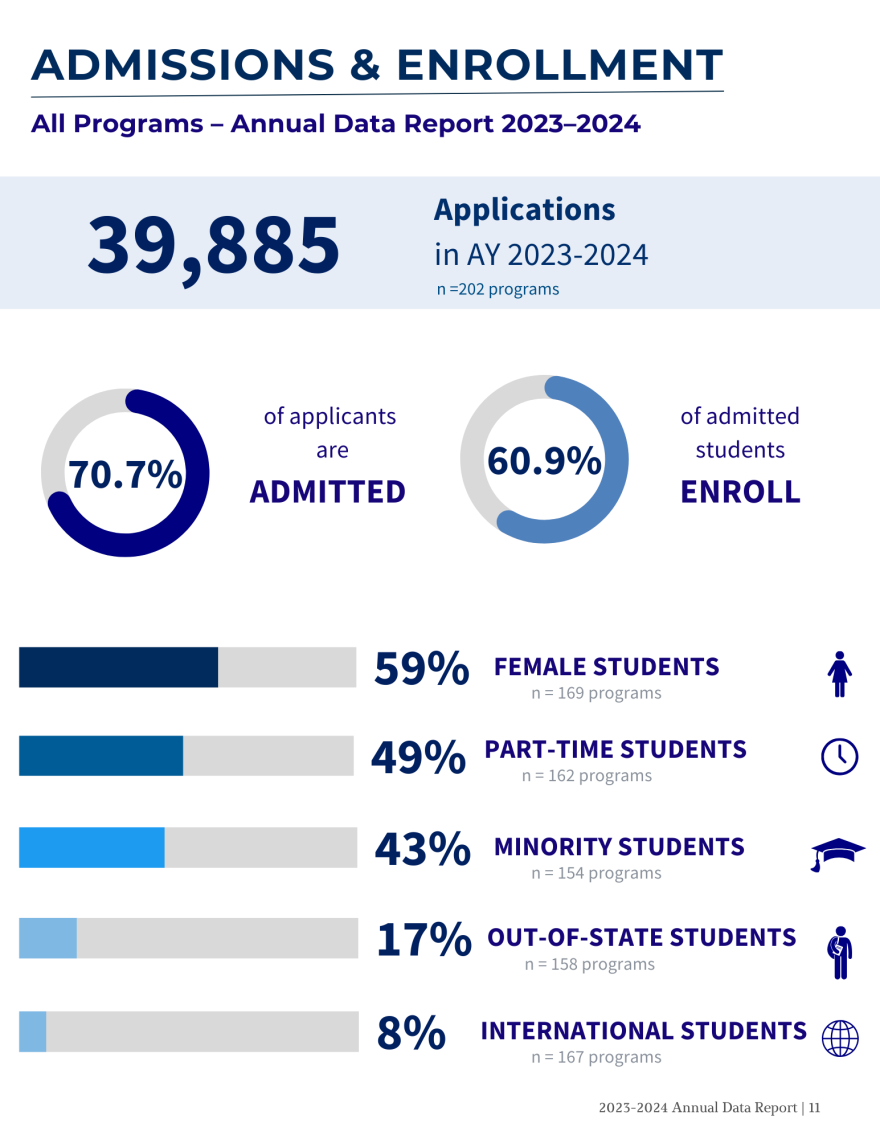
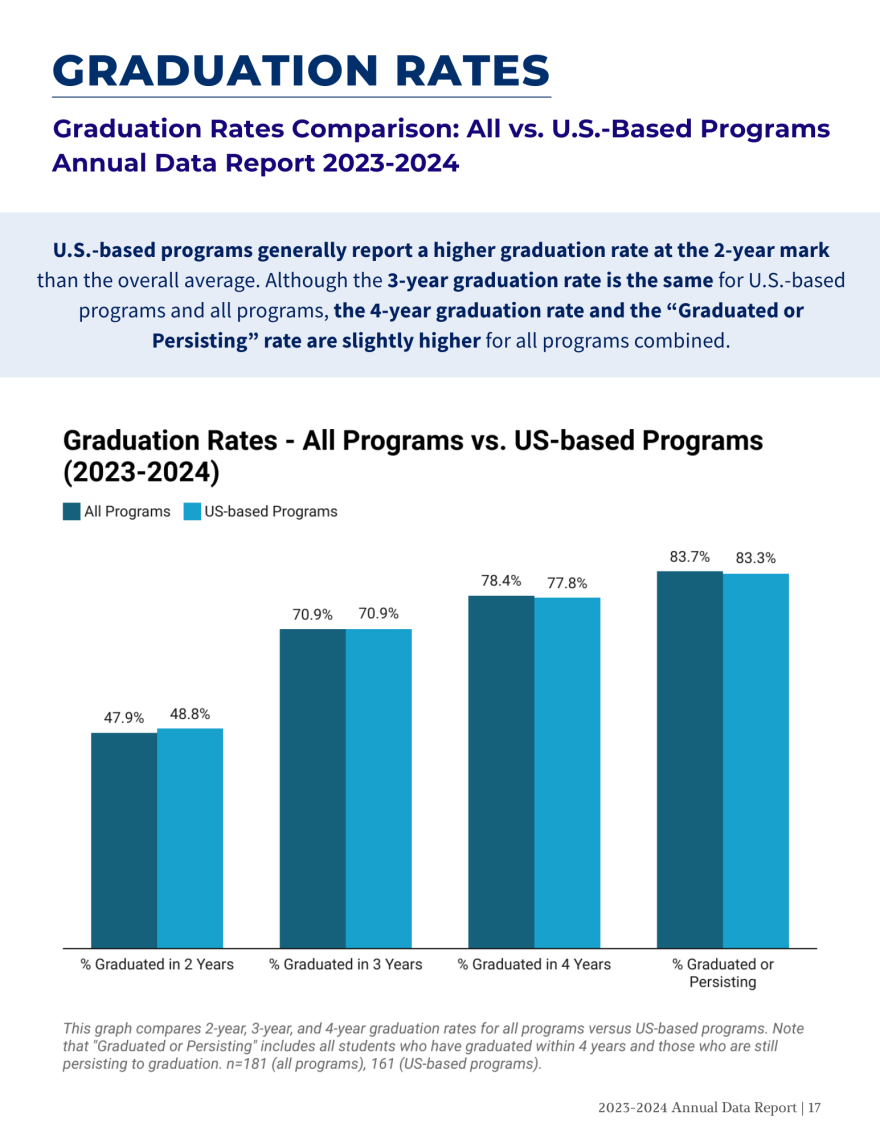
Since 2010, NASPAA has collected data on key outputs and outcomes of master’s degree programs of public service education to track the development in the field, producing annual reports to present and analyze the aggregated data. The 2023-2024 Accreditation Data Report is the thirteenth annual data report on NASPAA Accredited Programs. The 2023-2024 report analyzes and concludes the education performance of 208 accredited programs and programs seeking accreditation in academic year 2023-2024. Data in this report are provided by programs and collected by NASPAA from Self-Study Reports, Annual Accreditation Maintenance Reports, and Annual Program Surveys. See key insights and visualizations below.
Download the 2023-2024 Accreditation Data Report
Past Accreditation Data Reports
- 2022-2023 NASPAA Accreditation Data Report
- 2021-2022 NASPAA Accreditation Data Report
- 2019-2020 NASPAA Accreditation Data Report
- 2018-2019 NASPAA Accreditation Data Report
- 2017-2018 NASPAA Accreditation Data Report
- 2016-2017 NASPAA Accreditation Data Report
- 2015-2016 NASPAA Accreditation Data Report
- 2014-2015 NASPAA Accreditation Data Report
- 2013-2014 NASPAA Accreditation Data Report
- 2012-2013 NASPAA Accreditation Data Report
- 2011-2012 NASPAA Accreditation Data Report
- 2010-2011 NASPAA Accreditation Data Report
Where Do Accredited Program Graduates Work?
Trends in Employment of Accredited Program Graduates (2009-2018)
Data from Prior Data Reports (through 2016)
Data on accredited programs from the AY 2010-2016 Annual and Self-Study Reports (non-identifiable) are available in an Excel spreadsheet. Click the button below.
Trends Data from AY 2010-2016 Annual Data and Self-Study Reports (non-identifiable)
2013 Diversity Report
The 2013 NASPAA Diversity Report seeks to not only compare the data presented in the NASPAA Diversity Report published in 2000, but also to convey the trends and changes in the state of diversity over the past decade. The first section focuses on the racial and gender diversity changes in the student body. The second section focuses on the racial and gender diversity trends in the faculty body. Finally, the third section will show the state of universal competency analysis and implementation in terms of communication with diverse communities and changing workforces.
To obtain the source data for this report please contact data@naspaa.org.
Interested in conducting a deeper dive into data collected on behalf of accreditation? Refer to COPRA’s research proposal guidelines, here, to begin the proposal process!